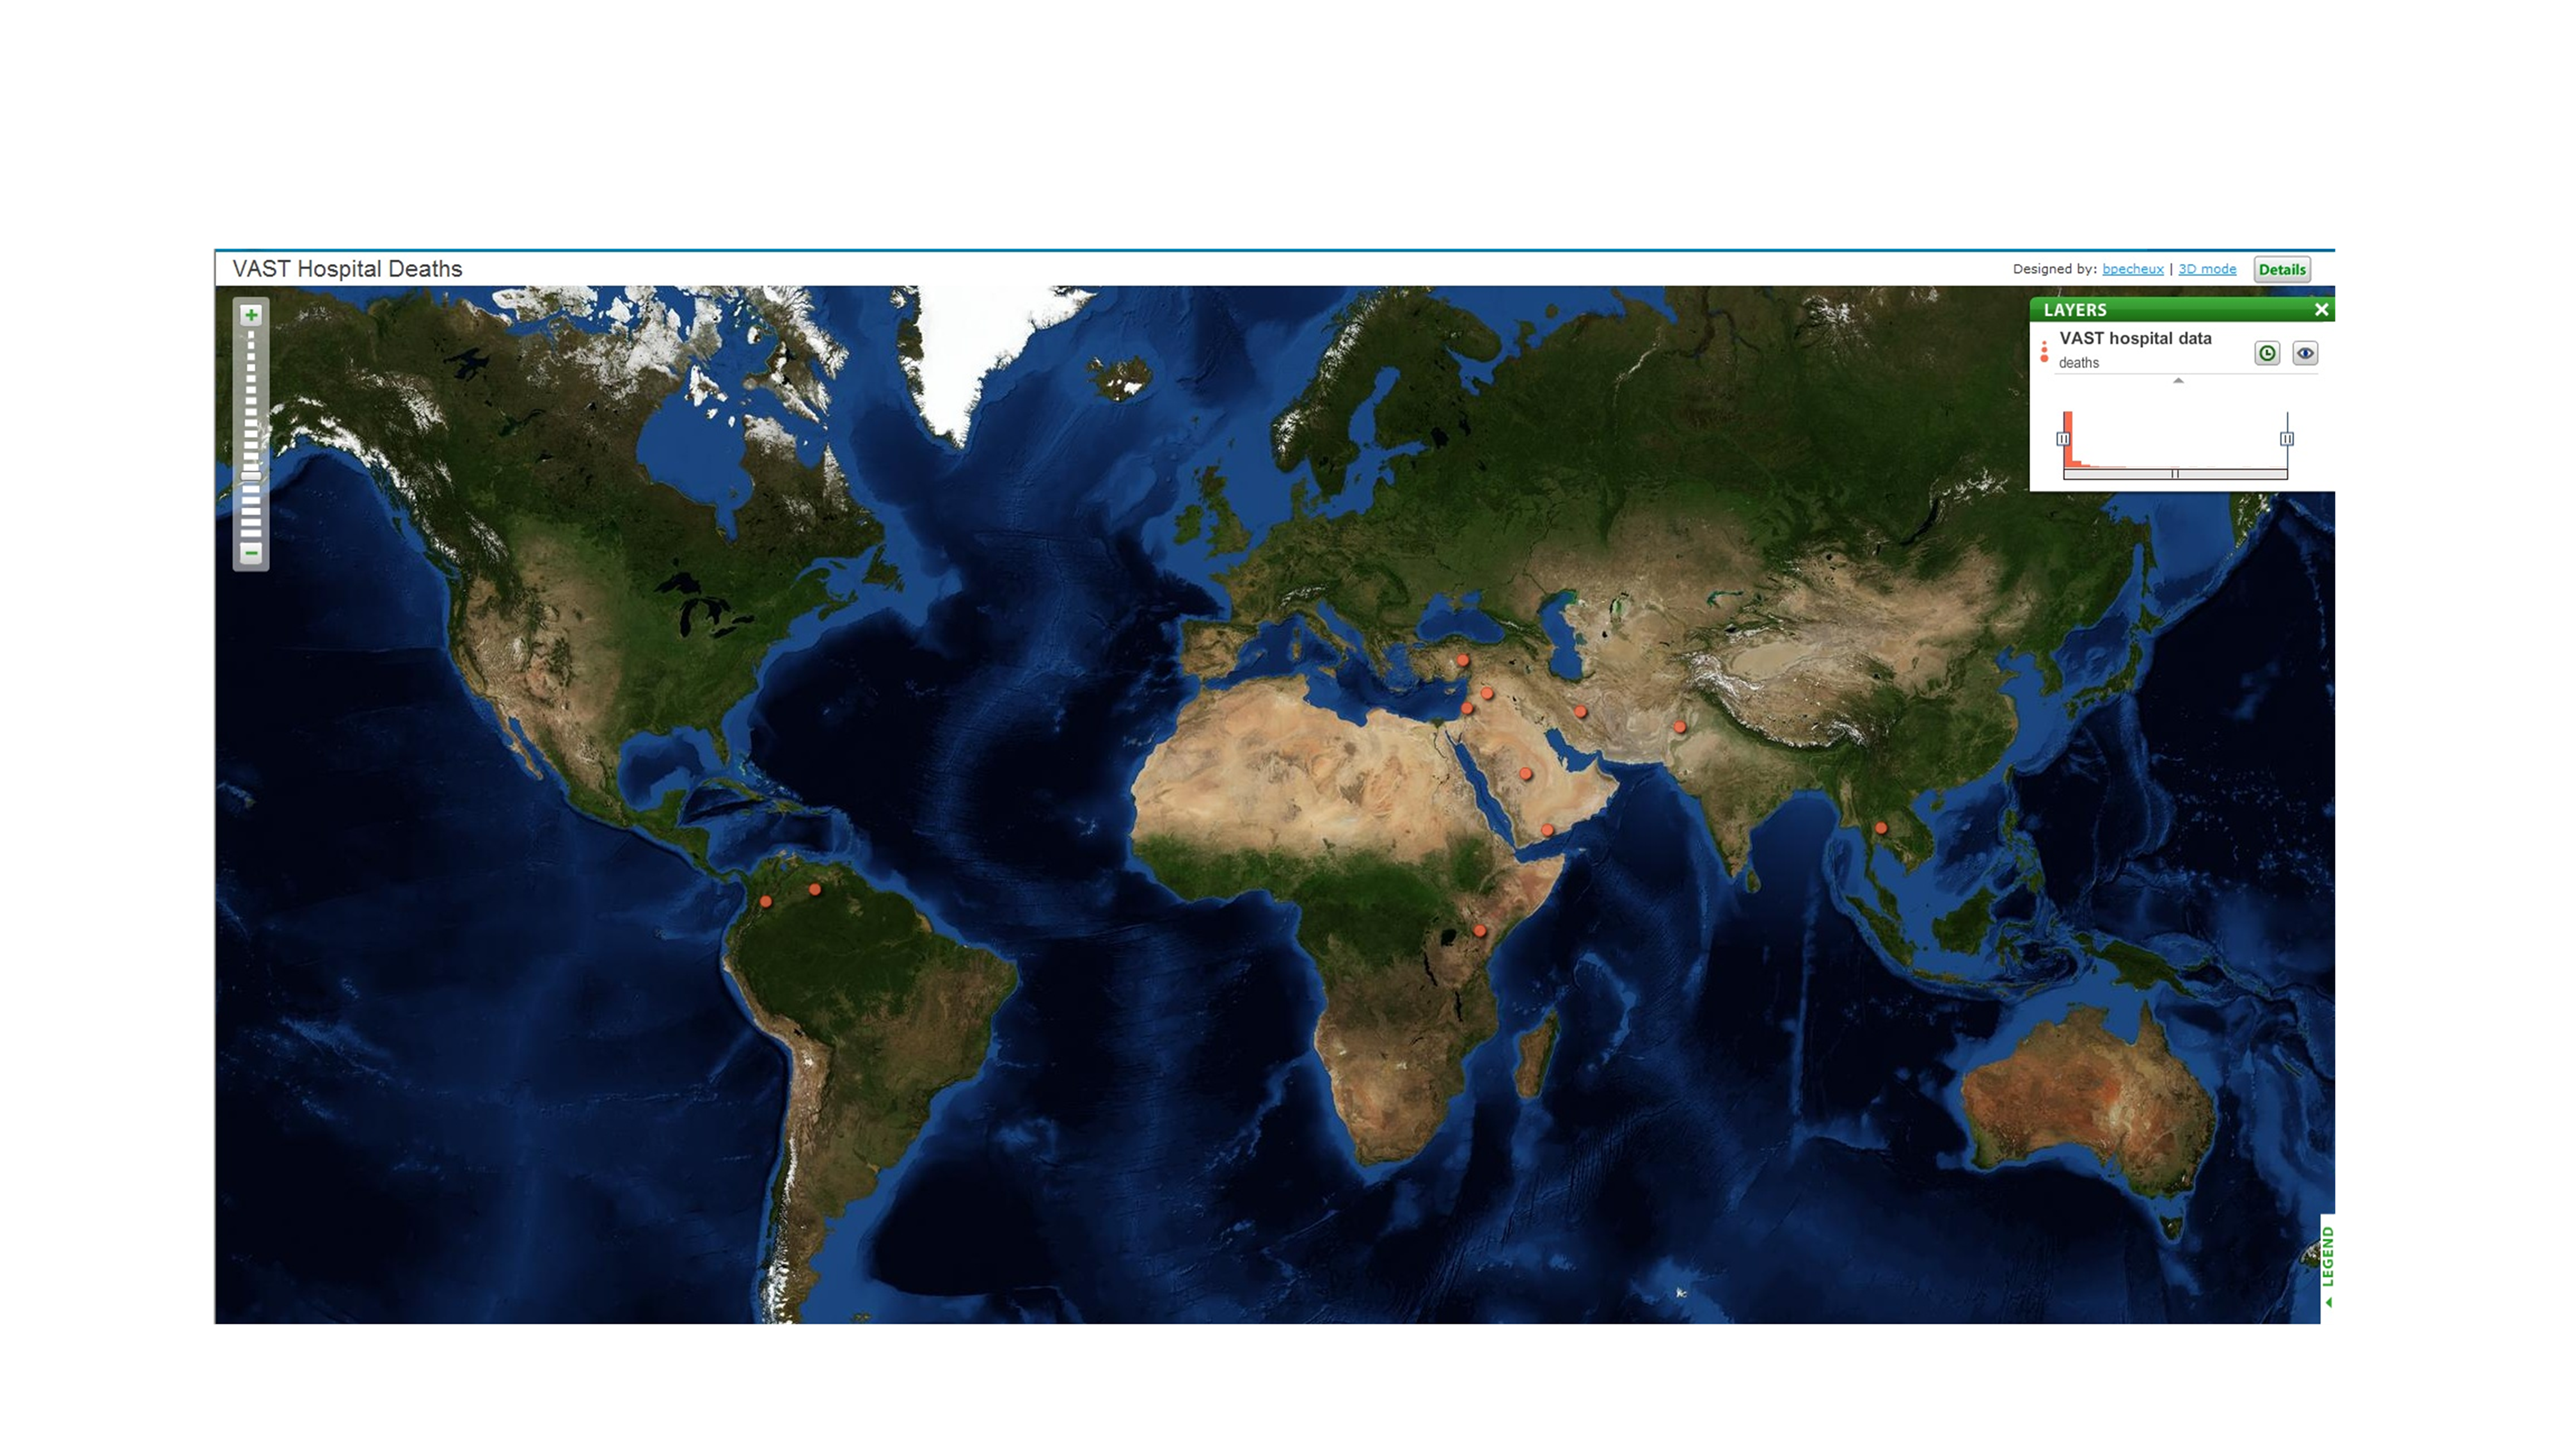
Figure 2.1.3. Animated GeoCommons Geographic View of Mortality Timelines
[
Return to MC2
]