Short Answer:
First, we determined that the criteria for a “successful” landing were twofold: (1) that the incident was a landing, rather than an interdiction, and (2) that the passengers survived their migration.
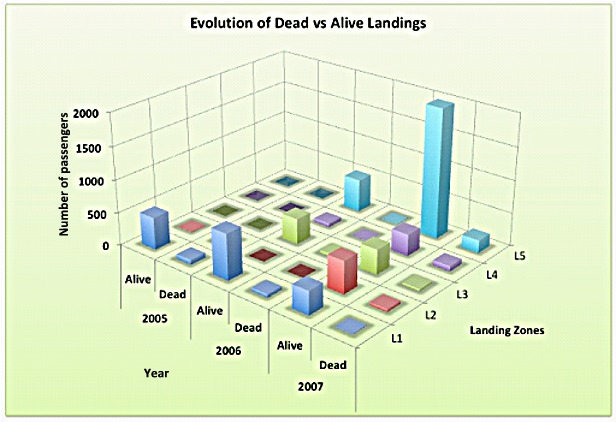
We primarily used our Excel charts to visualize and analyze this. Boats-1's Figure 5, shows the first criteria; Figure 1 (below), the second.
Figure 1. Number of dead/alive passengers by landing zone and year
From 2005-2007, the number of landings surpassed the number of interdictions—but only in that final year (illustrated in Boats-1's Figure 5).
Table 1 presents the successful landing rate over the three years. A higher proportion of landings each year could relate to the total number of migrant boats increasing so greatly that Coast Guard was unable to keep up…or that the vast increase in Mexico-bound migrants put many cases out of US Coast Guard jurisdiction. With respect to the percentage of living passengers in landings, we do not have enough information to identify if the changes in percentages are significant over the years.
Table 1. Successful landing rate over the three years
Year |
% of incidents that were landings |
% of living passengers in landing incidents |
2005 |
30% |
86% |
2006 |
43% |
94% |
2007 |
57% |
91% |