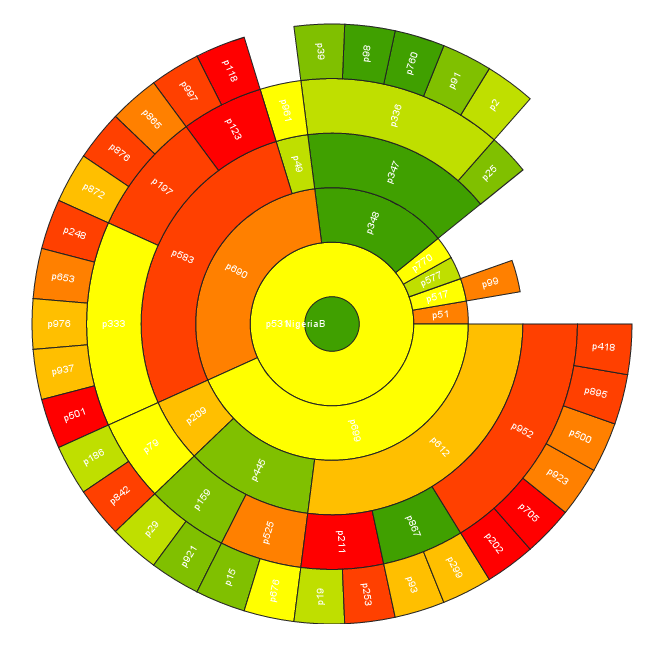
Figure 3.4.4. Sunburst Plot Showing Pedigree of Patients Colored by Overall Severity [
Back to MC3
]