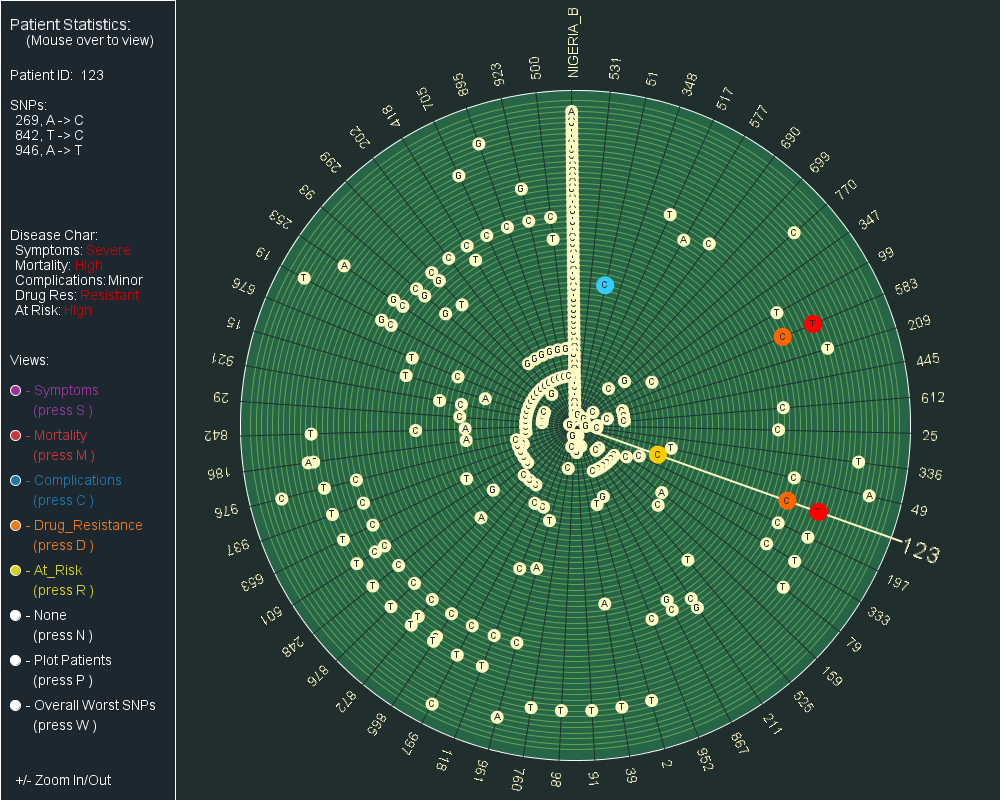
Figure 3.2.2. Polar Plot Highlighting Patient SNPs [
back to MC3
]