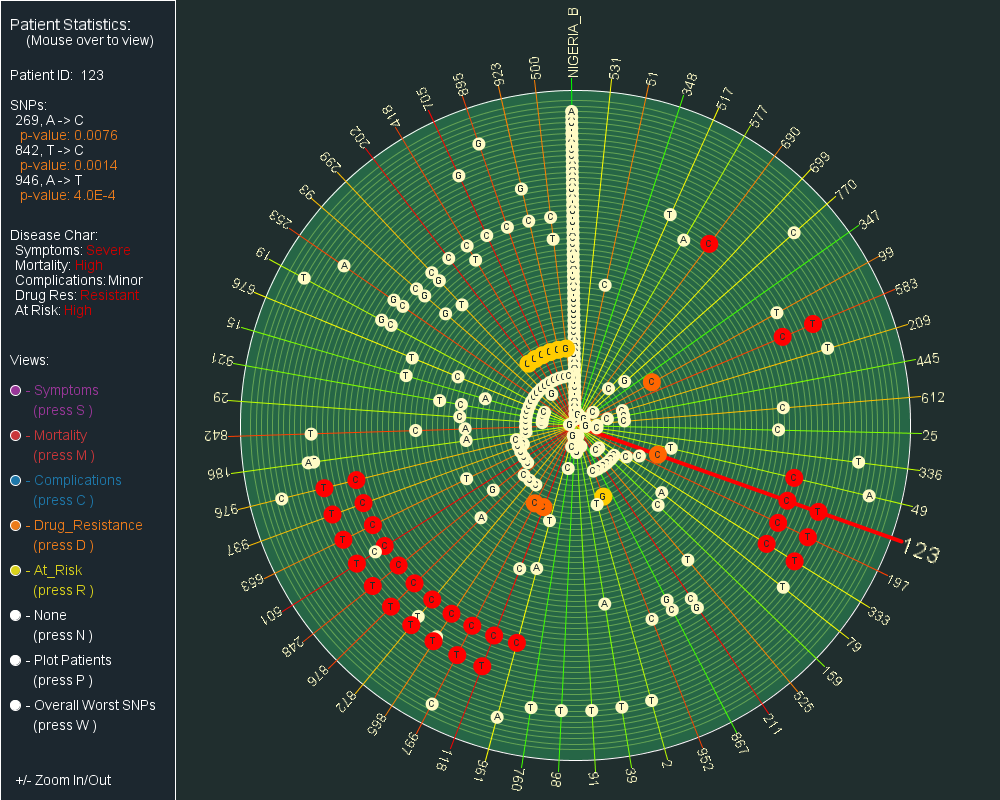
Figure 3.4.5. Polar Plot Showing Significant SNPs Colored by Overall Disease Severity [
Back to MC3
]