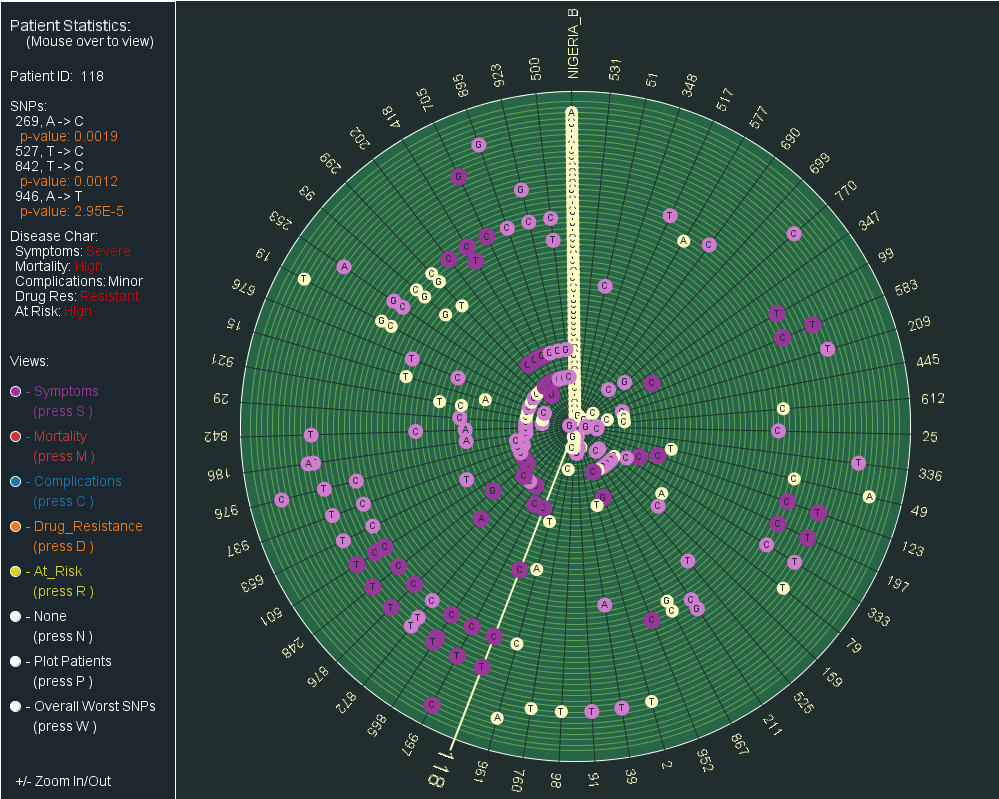
Figure 3.3.2. Polar Plot Identifying SNPs in Sequences [
Back to MC3
]