Group |
Names |
|
Strong supporters with scientific attitude (support movement; want wiki page to be credible) |
e.g., VictoriaV, Amado, 66.66.125.x |
|
Strong opposers with scientific attitude (oppose movement; want wiki page to be credible) |
e.g., Rm99, Agustin |
|
Devotees (support movement; don’t care about credibility of wiki page) |
e.g., RyogaNica |
|
Denouncers (oppose movement; vandalize/maliciously attack/destroy wiki page; don’t want page/discussion to stabilize or become credible) |
e.g., Alejo, DavidMorÛn, other people/IPs that vandalize |
|
Wikipedia-Supporters |
(no visible bias in movement; promote neutrality of Wikipedia) |
e.g., Sara, other editors |
(no visible bias in movement; edit quality of specific Wiki page) |
e.g., Adriano |
|
(seemingly non-extreme bias for or against movement; uses neutral arguments and easygoing attitude to promote point of view) |
e.g., Edemir, Gustava |
|
Detailed Answer:
Drawing on the skills of our diverse team members, an industrial engineering doctoral student and two technical communication master’s students, our methodological approach for addressing the Wiki mini-challenge was twofold: (1) computer software (notably, Pirouette, a multivariate analysis software; and Microsoft Excel) and (2) collaborative rhetorical analysis. The latter of these methods enabled us to use our technical communication skills, as we examined the Wiki players and textual clues. Rhetorical analysis is a method that goes back to Aristotle: it is a way to look at communication situations, by focusing on a speaker (here, a Wiki player) and his/her purpose, audience, constraints, etc.
Methodology:
Transfer rough edit data to Microsoft Excel
In this step, we broke each of the edit data entries into pieces and created an Excel spreadsheet that allowed clarity of the data, and allowed us to sort the edits by date, author, “m” (indicating a self-reported minor edit), size of Wiki page, etc. Such a transfer of medium would prove useful in examining the edit data.
Focus on Wiki discussion page
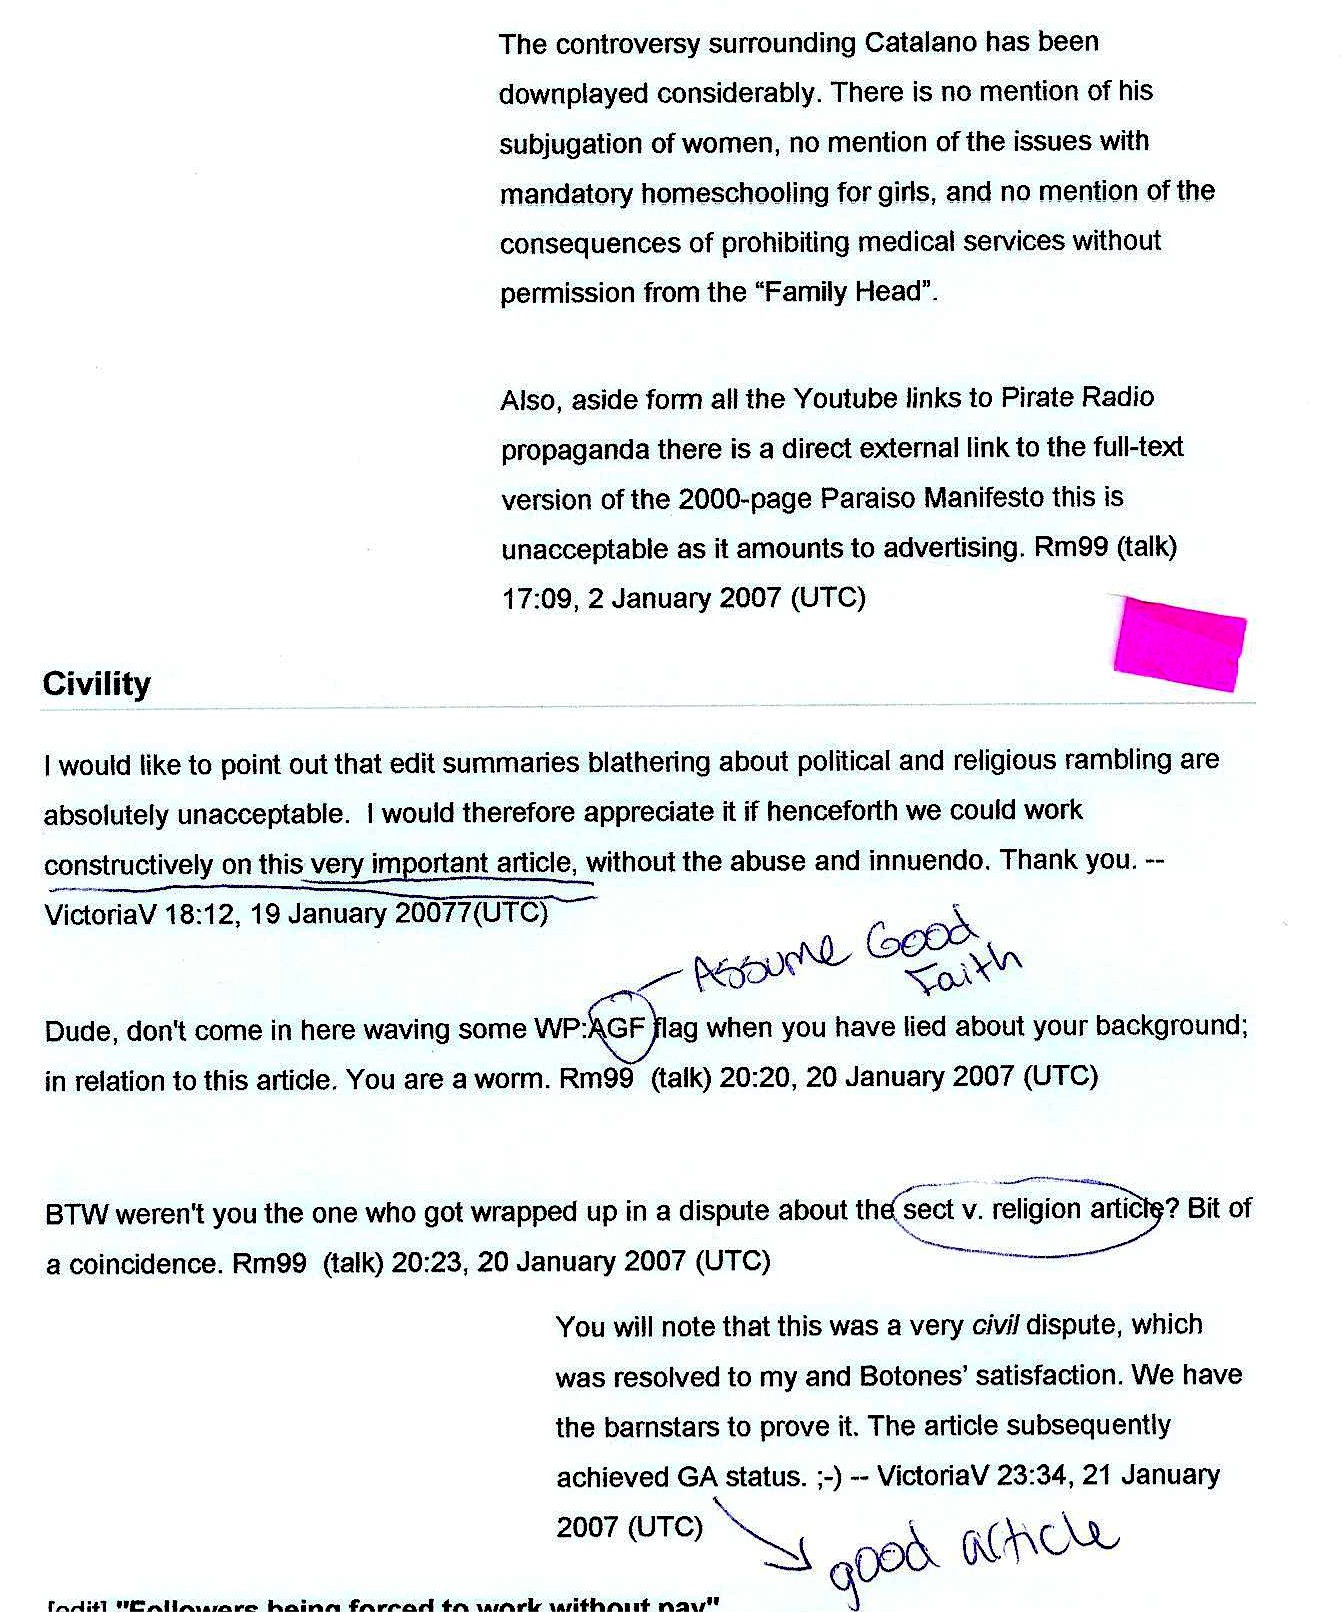
Once the rough edit data was in Excel, we set it aside for the time being and turned to the Wiki discussion page, which relates to a different page than the one represented in the Wiki edits. Each team member read the discussion page excerpts individually, then we came together to discuss and analyze the major participants in these each of these discussion excerpts (VictoriaV, Agustin, Edemir, and Rm99). We examined, through rhetorical analysis:
Figure 1. Discussion page excerpt
Focus on Wiki edits
With a handle on some of the major participants in the Wiki environment, we turned back to the Wiki edit data. Using highlighting to make certain individuals stand out (and to indicate back-and-forths between editors), we identified major players. These were people who crossed over from the discussion page and those who had a large number of edits or made vandalistic edits. We found themes of vandalism and of edit warring. Clearly, the Paraiso movement is controversial!
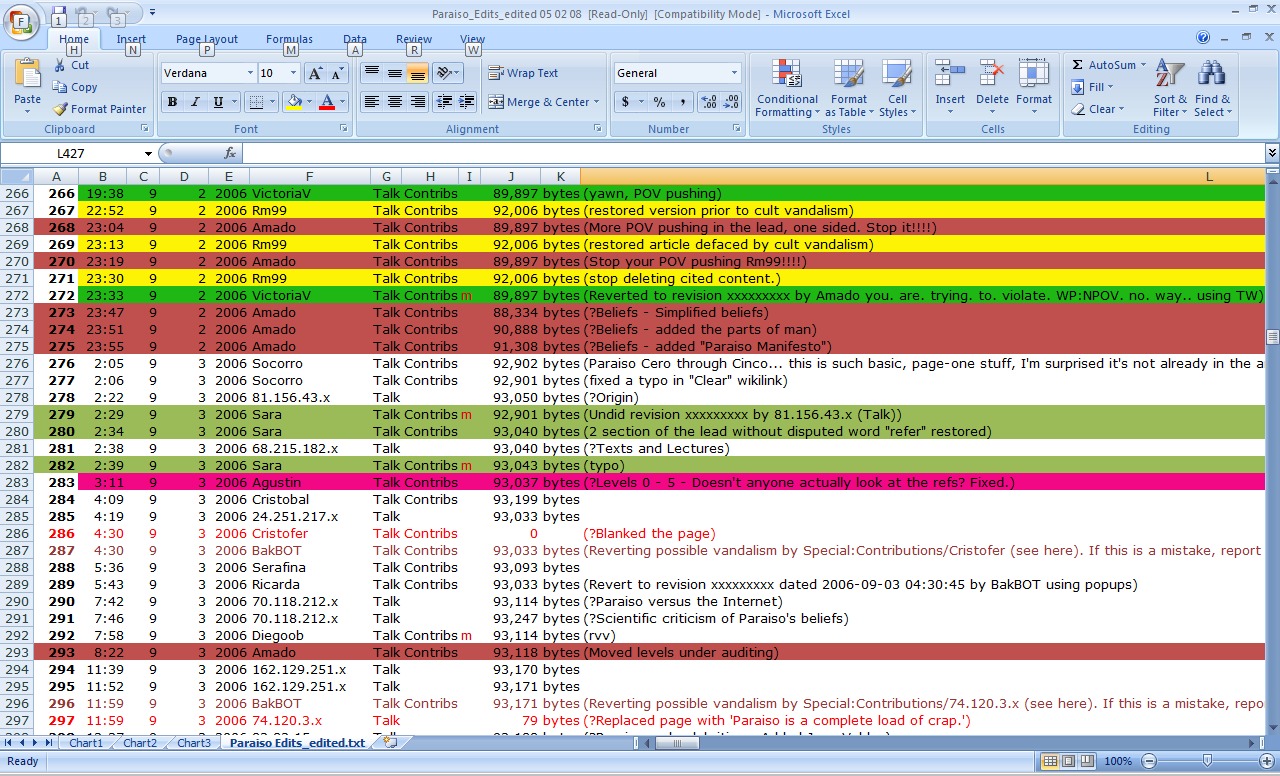
Figure 2. Highlighted edit data
With all team members present, we coded our major players on three dimensions, using a -2 to +2 scale for each dimension. This was a manual coding process, accomplished by lively verbal discussion between team members. If there was any disagreement, we discussed until we came to an agreement.
Generate visualizations; Develop conclusions
Using this data, we moved into a visual analytic phase, turning from our rhetorical approach to our software-assisted approach. With two pieces of software, we graphed our key players, along our three dimensions. Our initial graphing used Excel to generate a basic chart (Figure 3). Then, we shifted to using Pirouette, a multivariate analysis software (Figure 4; Figure 5). These tools helped us determine clusters of key players, which signified key factions of Wiki participants.
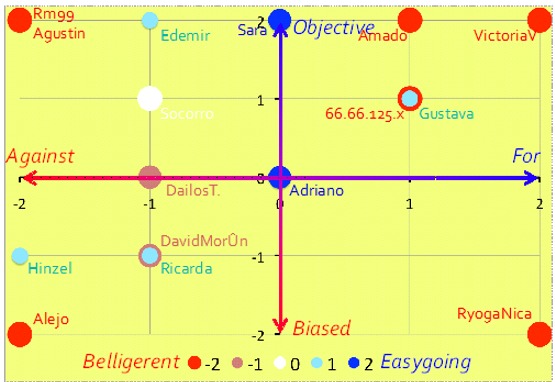
Figure 3. 2-D scatter plot of major players (from Excel)
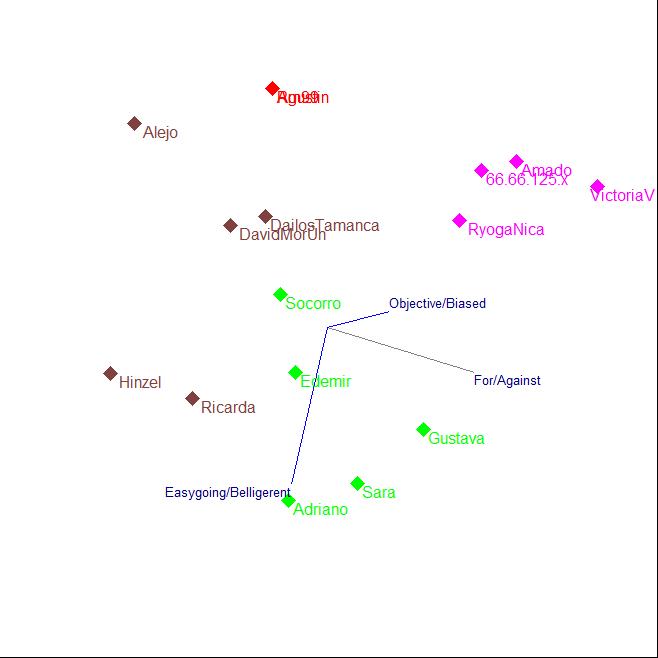
Figure 4. 3-D scatter plot of major players(from Pirouette)
Figure 5. Video clip of rotating Pirouette scatter plot (the 3-D graph can be manually rotated in Pirouette’s software, and a video capture can be taken)
Pirouette allowed us to create 3D graphs that can be rotated (thus examinable from all angles) and also used algorithms to break our key players automatically into similarity groupings, given the three dimensions we had determined. The resulting dendrogram (Figure 6) illustrated the breakdown of key players and their similarities to one another.
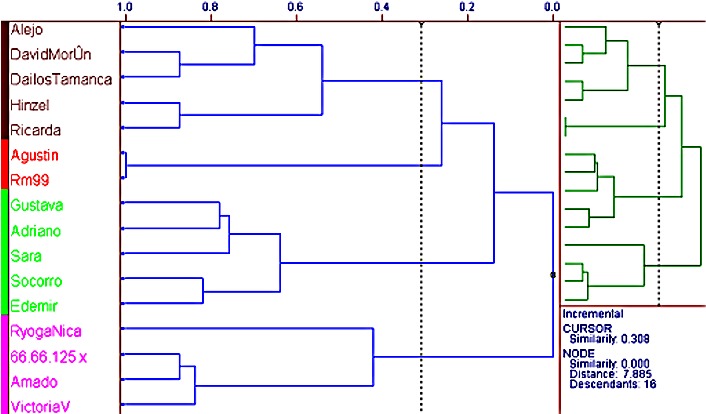
Figure 6. Dendrogram, showing similarities between major players and indicating initial faction possibilities from Pirouette)
To gather additional data about the atmosphere of the page and participant roles, we examined the Wiki page size, through the edit data (Figure 7). This allowed us to see patterns of vandalism—minor (indicated by commented vandalism accusations) and major (page deletion or replacement).
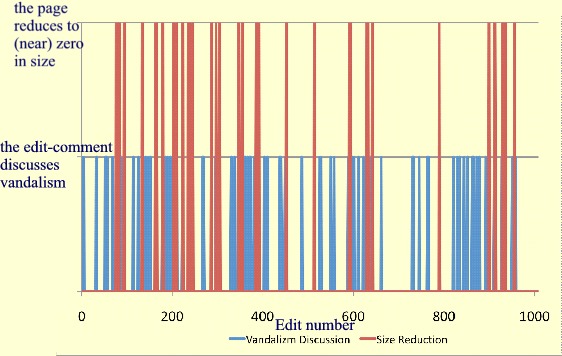
Figure 7. Patterns of vandalism (major and minor) (from Excel)
We then combined information illustrated in visualizations created with Pirouette and Excel with our rhetorical discussion of the data. We manually re-examined what we knew about the key players from their editing behavior and interactions on Wiki discussion page excerpts with the initial factions indicated by Pirouette’s dendrogram. We were able to develop and name the following five factions: